Trading Strategies · Lesson 4/70 · 4 min read
Support, Resistance, and Breakout Trading
In this article
What Are Support and Resistance
- Support: A price level where a decline has repeatedly stalled and bounced. It's a level the market has shown, more than once, that "strong buying pressure shows up below here."
- Resistance: A price level where a rally has repeatedly stalled and reversed. It's a level the market has shown, more than once, that "strong selling pressure shows up above here."
Resistance ─────●────────●──────  ← rally repeatedly stalls here
               ╱ ╲      ╱ ╲
              ╱   ╲    ╱   ╲
Support    ──●─────●──●──────●──  ← decline repeatedly stalls here
Why Price Keeps Stalling at the Same Level
Support and resistance form because of market participants' "memory."
- Investors who got caught buying at a certain price often leave standing sell orders around "I'll sell once I'm back to even," concentrating selling pressure at that level (forming resistance).
- Investors who remember a bounce happening at a certain price often leave standing buy orders around "it'll probably bounce here again," concentrating buying pressure at that level (forming support).
- Round numbers (like $50 or $100) also tend to attract a psychological concentration of orders.
Support and Resistance Can Swap Roles
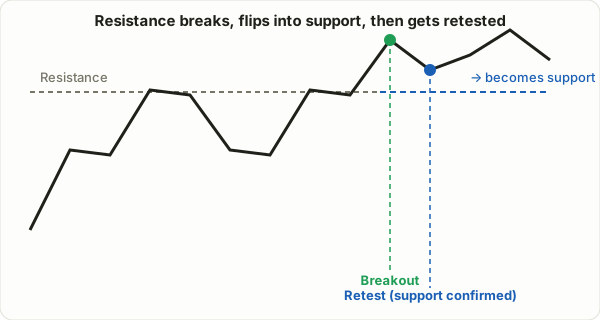
An important property: once resistance is broken through decisively, it often starts acting as support going forward (and the same works in reverse). This happens because of a psychological shift — "this used to be a level where sellers piled in, but now that price has broken through it, buyers start piling in instead."
What Is Breakout Trading
A breakout strategy treats the moment price decisively breaks above a resistance level it's been stuck under for a long time as a buy signal. The logic: a price that's been capped by resistance for a long stretch, finally breaking through that ceiling, means buying pressure has absorbed all the selling that had piled up there — suggesting there's more room to run.
A Basic Trading Rule Example
- Identify a well-defined range where price has formed a clear resistance level over a meaningful period (weeks to months).
- Confirm the breakout candle is accompanied by a volume increase.
- Enter either at the breakout candle's close, or after a retest (price returns and confirms support at the old resistance level).
- Set your stop below the broken resistance level (now acting as support).
- A common first target is the breakout price plus the height of the prior range.
Target = Breakout price + (Resistance level - Range's lower support level)
Watch Out for False Breakouts
⚠️ The most common failure pattern is the "false breakout." Price barely breaks above resistance, then immediately falls back inside the range. Traders who chased the breakout late get stopped out, which can even accelerate the decline.
Ways to reduce false-breakout risk:
- Confirm with volume: A genuine breakout is usually accompanied by noticeably higher-than-normal volume. Be suspicious of a breakout without volume.
- Judge by the close: Instead of counting a brief intraday poke above resistance as a real breakout, require that period's close to be above the level.
- Wait for a retest: Instead of buying immediately on the breakout, wait for price to pull back to the old resistance (now support) and confirm it holds before entering — though if price never comes back for a retest, you risk missing the trade entirely.
Volume Profile: Finding Support/Resistance From Volume, Not Just Price
The support and resistance described so far are found visually — spotting price levels where price stalled repeatedly. A more quantitative tool for the same idea is the Volume Profile, which shows a sideways bar chart of how much volume actually traded at each price level, rather than price over time.
- HVN (High Volume Node): A price level where an unusually large amount of volume traded. Since a lot of investors actually transacted at this price, it's likely to act as support or resistance if price revisits it.
- LVN (Low Volume Node): A price level where very little volume traded. Price tended not to "linger" here and moved through quickly, so it tends to move through relatively fast again if revisited.
Where traditional support/resistance counts "how many times price stalled," volume profile shows directly "how much actual money traded at that price" — making it a useful complementary tool.
Summary
- Support is a level where declines repeatedly stall; resistance is a level where rallies repeatedly stall.
- A decisively broken resistance level often flips into support going forward.
- A breakout strategy treats a volume-confirmed break above range resistance as a buy signal, while managing false-breakout risk through volume confirmation or waiting for a retest.
In the next lesson, we'll cover a framework built around liquidity and price imbalance concepts: the basics of ICT smart money concepts.