Trading Strategies · Lesson 1/70 · 4 min read
Moving Average Crossover Strategy
In this article
- What Is a Moving Average (MA)
- Golden Cross and Death Cross
- A Basic Trading Rule Example
- Why It's Believed to Work: Trend-Following Logic
- Limitations and Drawbacks
- Ways to Improve It in Practice
- Simple Moving Average (SMA) vs. Exponential Moving Average (EMA)
- Using Three Moving Averages Together
- Summary
What Is a Moving Average (MA)
A moving average is a line connecting the average closing price over the last N days. A 20-day moving average (MA20), for example, is the average closing price over the most recent 20 trading days including today. Each day, the oldest day drops off and today's close gets added, so the average shifts — hence "moving" average.
The role of a moving average is to smooth out day-to-day noise so you can more easily see the overall trend in price.
- Short-term MA (e.g., 5-day, 20-day): Reacts quickly to recent price changes
- Long-term MA (e.g., 60-day, 120-day, 200-day): Shows the bigger picture, more gradually
Golden Cross and Death Cross
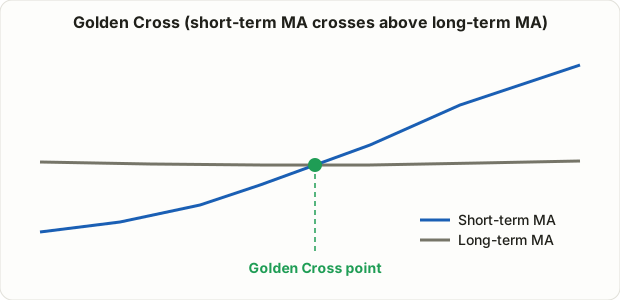
The core idea of a moving average crossover strategy is simple: when a short-term MA crosses above a long-term MA, it's read as a signal the trend is turning up; when it crosses below, it's read as a signal the trend is turning down.
- Golden Cross: The short-term MA crosses from below to above the long-term MA → interpreted as a buy signal
- Death Cross: The short-term MA crosses from above to below the long-term MA → interpreted as a sell signal
The most widely known pairing is the 50-day and 200-day moving averages. When the 50-day crosses above the 200-day, that's a golden cross; when it crosses below, that's a death cross. Shorter-term traders often use much tighter pairings, like a 5-day and 20-day MA.
A Basic Trading Rule Example
- Plot a short-term MA (e.g., 20-day) and a long-term MA (e.g., 60-day) on your chart.
- Consider buying the moment the short-term MA crosses from below to above the long-term MA (golden cross).
- Set your stop below the most recent swing low, or below the long-term MA.
- Consider exiting when the short-term MA drops back below the long-term MA (death cross).
Why It's Believed to Work: Trend-Following Logic
This strategy is based on the observation that "once a trend starts, it tends to persist for a meaningful period." A golden cross is a delayed confirmation that price is under both short- and medium-term upward pressure. You can't buy exactly at the bottom this way, but you can confirm a trend is already forming and ride it.
Limitations and Drawbacks
⚠️ Moving averages are a lagging indicator. Because they're built from past prices, the signal always shows up later than the actual trend change. By the time a golden cross appears, the price has often already moved up quite a bit.
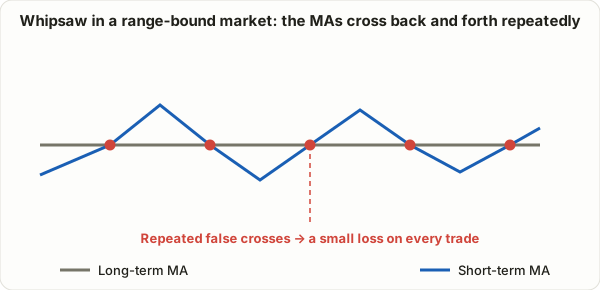
The biggest weakness is repeated losses in a sideways (range-bound) market — known as whipsaw. When price moves without a clear trend, chopping sideways in a tight range, the short- and long-term MAs keep grazing past each other, generating golden cross / death cross signals in rapid succession. Trading every one of these signals racks up small losses each time.
Ways to Improve It in Practice
- Add a trend filter: Check the slope of the long-term MA (is it actually rising?) and ignore golden cross signals when the long-term MA is flat or declining
- Confirm with volume: Check whether volume increased at the crossover — a crossover without volume confirmation tends to be less reliable
- Check multiple timeframes: Even if a crossover shows up on the daily chart, be cautious if the weekly trend is pointing the opposite direction
Simple Moving Average (SMA) vs. Exponential Moving Average (EMA)
The "average of the last N days' closes" described so far is, precisely, a Simple Moving Average (SMA). In practice, the Exponential Moving Average (EMA) is also widely used.
- SMA: Weights every one of the N days' closes equally — today's data counts the same as data from 20 days ago.
- EMA: Weights recent data more heavily — today's close moves the average more than a close from 20 days ago does.
Because of this, EMA reacts to price changes faster than SMA. Many short-term traders prefer EMA for that responsiveness; others prefer SMA's relative stability, since it's less rattled by noise. Neither is objectively superior — it's a choice that depends on your trading style.
Using Three Moving Averages Together
Instead of just a short/long pairing, some traders plot three moving averages — short, medium, and long — together. For example, plotting the 5-day, 20-day, and 60-day MAs, and only treating it as a confirmed uptrend when they're stacked in that exact order from top to bottom (5-day > 20-day > 60-day).
Layering three MAs like this filters out weaker trend segments far more strictly than a two-MA pairing — at the cost of signals arriving later and less frequently. This is another place where you can see the general rule that signal accuracy and signal frequency tend to trade off against each other.
Summary
- A moving average crossover strategy uses the point where a short-term MA crosses a long-term MA as a trend-reversal signal — a trend-following approach.
- A golden cross is read as a buy signal; a death cross as a sell (or exit) signal.
- Being a lagging indicator and prone to whipsaw in range-bound markets are real limitations, which is why it's often combined with a trend filter or volume confirmation.
In the next lesson, we'll cover a different approach from trend-following: the momentum trading strategy.