Trading Strategies · Lesson 70/70 · 10 min read
13F Filings: Cloning Superinvestor Portfolios the Right Way
In this article
- Why "What Buffett Bought" Is Still News Every Quarter
- What Form 13F Actually Requires
- Three Screening Signals Worth Using
- A Worked Example: A Hypothetical Fund's Quarter-over-Quarter Shift
- Three "Public Paper Trail" Strategies Compared
- The 45-Day Trap: What a Snapshot Hides
- Where to Check This for Free
- Limitations and Pitfalls
- FAQ
- Summary
Why "What Buffett Bought" Is Still News Every Quarter
The pattern repeats every quarter without fail. The moment 13F filings from names like Warren Buffett, Bill Ackman, or Stanley Druckenmiller land on SEC EDGAR, financial media run headlines about "what the billionaires bought." When the same stock shows up as a brand-new position across several well-known hedge funds in the same quarter, that alone becomes a story, and the stock's price can move noticeably in the hours after the filing hits. This is possible for one simple reason: institutions managing enough US equity assets are legally required to disclose their holdings.
Tracking 13F filings sits in the same broad category as Lesson 37's Form 4 insider cluster buying and Lesson 33's congressional STOCK Act disclosures — all three are about following a legally mandated paper trail left by people with an information edge. But 13F differs from both in who files it, how often, and most importantly, in what it structurally hides. This lesson covers exactly what a 13F shows and doesn't show, and how to screen it in a way that's less likely to mislead you.
What Form 13F Actually Requires
Form 13F is the quarterly holdings disclosure that institutional investment managers with more than $100 million in qualifying US equity assets must file with the SEC. "Institutional manager" is a broad category — hedge funds, mutual funds, insurance companies, pension funds, and large family offices all fall under it. The filing deadline is 45 days after quarter-end, and it discloses a snapshot of holdings as of that quarter-end date, not a running log of trades.
Knowing exactly what counts and what doesn't is the first step toward not misreading this data.
| Asset type | Disclosed on 13F? | Note |
|---|---|---|
| US-listed long stock positions | Yes | The core data this lesson covers |
| US-listed ETFs | Yes | Can reveal sector or thematic bets |
| Convertible bonds and similar securities | Yes | Smaller weight, but reportable |
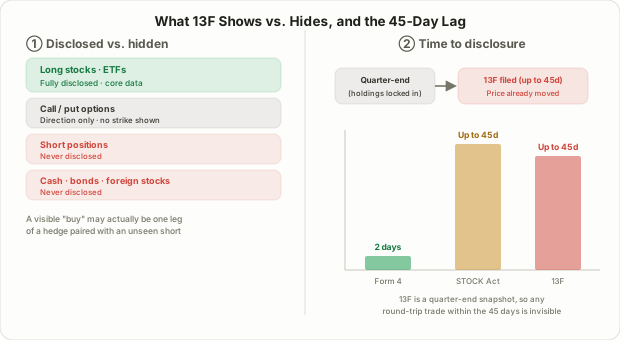
| Call and put options | Yes (direction only) | Strike price and expiration aren't required, so hedge vs. directional bet is often unclear |
| Short positions | No | 13F's biggest blind spot — covered below |
| Cash and non-convertible bonds | No | You can't see the fund's actual cash allocation |
| Non-US-listed equities | No | Foreign-exchange-listed holdings aren't included |
| Private company stakes | No | Venture or private-equity holdings never appear |
Three Screening Signals Worth Using
Scrolling through a raw 13F listing hundreds of line items deep isn't an efficient use of time. Trackers and experienced investors generally boil the data down to three signals. As with the earlier lessons in this category, these are industry conventions, not official regulatory thresholds.
| Signal | What to look for | Interpretation |
|---|---|---|
| New position | A stock that wasn't in the prior quarter's filing shows up for the first time | Possibly a freshly formed conviction |
| Conviction add | The same stock's weight as a % of the portfolio rises noticeably quarter over quarter | Growing confidence in an existing thesis |
| 13F cluster (overlap) | Multiple managers with different styles open the same new position in the same quarter | Less likely to be coincidence, more likely a shared valuation read |
| Full exit | A stock that was held last quarter disappears entirely | The original thesis may have broken, or the target price was hit |
The cluster signal is especially useful. When a value-oriented manager and a macro-driven manager — approaching the market from entirely different angles — both initiate the same new position in the same quarter, that's a stronger signal than either one alone, simply because it reflects more independent angles of scrutiny converging on the same idea. Even then, it's only a qualitative inference that several parties noticed something similar around the same time — not evidence of coordination, and certainly not a guaranteed catalyst.
A Worked Example: A Hypothetical Fund's Quarter-over-Quarter Shift
Here's a purely illustrative scenario. Mid-cap value fund G shifts its portfolio as follows between Q2 and Q3:
| Position | Q2 weight | Q3 weight | Change |
|---|---|---|---|
| Stock X (held previously) | 8.2% | 11.4% | Weight increased — conviction add |
| Stock Y (new) | 0% | 4.8% | New position |
| Stock Z (held previously) | 6.5% | 0% | Full exit |
| Stock W (held previously) | 5.1% | 5.3% | Barely moved — noise level |
The two rows worth paying attention to are X and Y. Pushing Stock X's weight from 8.2% to 11.4% means the fund committed real additional capital, and building Stock Y up to nearly 5% of the portfolio from scratch suggests a genuine conviction bet rather than a token position. Stock W, by contrast, moving from 5.1% to 5.3% is more consistent with ordinary price drift during the quarter than an active decision, so it's not worth reading into. If Stock Y also shows up as a brand-new position in a different, stylistically unrelated fund's 13F for the same quarter, that satisfies the cluster condition described above.
Three "Public Paper Trail" Strategies Compared
13F, Form 4, and STOCK Act disclosures all come from the same root idea — using legally mandated disclosures to glimpse what people with an edge are doing — but they differ sharply in frequency, precision, and what they conceal.
| Aspect | 13F (institutions) | Form 4 (corporate insiders) | STOCK Act (Congress) |
|---|---|---|---|
| Filing frequency | Once per quarter | Per trade (within 2 business days) | Per trade (within 45 days) |
| Disclosure lag | Up to 45 days after quarter-end | Up to 2 business days | Up to 45 days (often longer in practice) |
| Short positions shown | No | N/A (own-company shares only) | Yes (as a range) |
| Dollar precision | Exact share counts, no purchase price | Exact shares and price | Range only |
| Nature of the edge | Portfolio-wide structural shifts | Direct knowledge of company operations | Indirect exposure to legislation and policy |
| Sample size | Thousands of managers | As many as there are public companies | Roughly 535 people |
All three share the same basic limitation — disclosed, but delayed, information. What sets 13F apart is an additional structural weakness unique to it: the quarter-end snapshot problem, covered next.
The 45-Day Trap: What a Snapshot Hides
Form 4 discloses a single trade within two business days of it happening. A 13F shows something fundamentally different: a single moment's holdings, as of quarter-end. That distinction creates problems that go deeper than the lag alone.
- Round-trip trades within the quarter vanish completely. If a manager built a large position mid-quarter and sold it entirely before quarter-end, the 13F shows nothing — no entry, no exit, no trace. The reverse is also possible: a stock added right at quarter-end and dumped at the start of the next one, sometimes called "window dressing," looks identical to a genuine new position in the data.
- Short positions are never reported. If a manager holds a 5% long position in Stock A while shorting a highly correlated Stock B as a pair trade, the 13F only shows a plain "buy" in Stock A. What looks like a directional bet may actually be a market-neutral strategy.
- Options direction is genuinely ambiguous. As the table above noted, 13F requires disclosing option holdings but not strike price or expiration. A call option position that reads as bullish could in fact be one leg of a more complex hedge involving puts on an existing stock holding.
- Confidential treatment can delay disclosure even further. The SEC allows managers to request temporary non-disclosure of specific positions when it judges doing so doesn't harm the public interest. Berkshire Hathaway used exactly this provision while building its stake in insurer Chubb through the third and fourth quarters of 2023 — the position only became public in Berkshire's Q1 2024 13F. A similar confidential "mystery stock" situation played out again in 2025. In other words, even the 13F you're looking at right now may not be the complete picture of that manager's portfolio at that moment.
- The filing itself can simply disappear. Michael Burry's Scion Asset Management deregistered with the SEC in November 2025 and wound the fund down. There is no longer a legal obligation for Scion to file a 13F at all — anything attributed to Burry now comes from his own voluntary public statements, which may be credible given his track record but are not the kind of third-party-verifiable disclosure a 13F represents.
Where to Check This for Free
Raw 13F filings are available to anyone, free of charge, through the SEC's EDGAR system. The raw filings are organized by CUSIP number, though, which makes them tedious for a casual reader to parse directly. Free tracker sites like WhaleWisdom, Dataroma, and HedgeFollow process this same underlying data into screens that surface a given manager's quarter-over-quarter changes, new positions, and cross-manager overlaps at a glance. Using a tracker's summary is efficient, but for any position you actually plan to act on, it's worth checking the EDGAR original once to rule out a tracker error or a gap left by confidential treatment.
Limitations and Pitfalls
- The quarter-end snapshot is a structural blind spot. Intra-quarter round trips, short positions, and the exact terms of any options never appear.
- 45 days is a longer lag than it sounds. For a volatile stock, the price at filing time can already look very different from the price at the original purchase.
- Confidential treatment can push disclosure out even further, so what you're reading may not be the full current picture.
- The signal dilutes at scale. In a portfolio spread across hundreds of names, one position's weight change rarely represents the fund's overall strategy.
- Survivorship bias is a real risk. Financial media repeatedly covers the managers who performed well; funds that lost money in the same period get far less attention.
- Not a standalone thesis. This is a supplementary data point, not a substitute for your own valuation and fundamental work.
FAQ
Where can I check 13F filings for free?
Search by manager name on the SEC's EDGAR system (sec.gov) to pull up every 13F-HR filing that institution has made, for free. Free tracker sites like WhaleWisdom and Dataroma reorganize the same data into a more readable view of new positions and weight changes.
Do 13F filings show short positions?
No. 13F only requires disclosure of long positions; short positions aren't reported at all. That means an apparent "buy" could actually be one leg of a pair trade or hedge, which is always worth keeping in mind.
Is it safe to just buy whatever a 13F shows a famous manager bought?
Keep in mind that by the time a 13F is public, it already reflects positioning that's up to 45 days stale relative to quarter-end. For a volatile stock, the price may have already moved significantly by the time you see the filing. Rather than acting purely because "a famous manager bought it," it's safer to think through why they likely bought it and weigh that against your own valuation work.
Summary
- Form 13F is a quarterly disclosure of US-listed long positions, required of institutions managing over $100 million, due within 45 days of quarter-end.
- Screening for new positions, conviction adds, and cross-manager overlap gives a more defensible read than looking at any single holding in isolation.
- 13F's quarter-end snapshot structure hides intra-quarter round trips, short positions, cash, and the precise terms of any options — and confidential treatment requests (as with Berkshire's Chubb stake) or a manager deregistering entirely (as with Michael Burry's Scion) can make even what you see incomplete.
- Compared with Form 4 (filed within 2 business days) and STOCK Act disclosures (up to 45 days, reported only as a range), 13F is the slowest and hides the most detail, but it's the only one of the three that shows a manager's entire portfolio structure shifting over time.
- Use EDGAR and free trackers together, but treat this data as a supplement to valuation and fundamental analysis, never a standalone buy or sell trigger.